Overview
With your data in AMS+, you may want to know what you can learn about your book of business. Or, you may want to analyze a set of policy data or track quarterly performance report data. Using AMS+’s Custom Reporting feature, you can create reports tailored to your specifications and save them to run again and again. You can download them and analyze your data or share with others. Learn more about custom reports in this article.
Note: Custom Servicing Reports can retrieve data only for Agent Records, Agency Records, Carrier Records, Group Records, Individual Records, Policy Records, Commission Entries and Payments, and Servicing Addresses. To access data on Sales Records, use Custom Sales Reports.
IN THIS ARTICLE
Basics of Custom Servicing Reports
To view and run custom reports, you must belong to a Security Group with the Reporting 'Visible' permission. In addition, you need the 'Visible' permission for Agent, Carrier, Commissions, Group, Individual, or Policy depending on the type of data you want to download.
What are report types?
Report types are the categories that contain fields for setting up filters and columns in Custom Reporting. Before building your report, you’ll need to choose the report type that will be your main focus, such as 'Individuals' or 'Addresses'. Then, you can start adding related records, such as policies, activities, notes, and more.
| Report type | Report details |
|---|---|
| Groups | Groups Details, Activities, Notes, and Related Options |
| Individuals | Individual Details, Activities, Notes, and Related Options |
| Policies | Policy Details, Coverages, Notes, Activities, and Related Options |
| Agents | Agent Details, Activities, Notes, E&O, Contracts, Licenses, Personal Info, and Related Options |
| Agencies | Agency Details, Notes, and Related Options |
| Carriers | Carrier Details, Activities, Notes, Forms, Product Details, Websites, and Related Options |
| Addresses | Addresses, Group Details, Individual Details, Agent Details, Carrier Details, Agency Details |
| Commissions |
Commission Entries, Commission Payments, Related Options Note: Available for accounts with the Commission Processing module only. Visit the Custom Commissions Reports article to learn more. |
What are Field Options?
Field Options are the fields, based on the report type, that you will use to set up your report columns and filters. You can move selected fields to the corresponding filter or column panel by dragging and dropping or using the 'Add Column(s)' and 'Add Filter(s)' buttons.
As you’ll see in the images below, the organization of the layout in a record (first image) aligns with the nesting in the Field Options panel (second image).
The exception is related option fields. Unlike the other fields, related option fields are associated with the report type. While they do not always appear directly on the record, they are associated with the record. For example, if you want a list of all policies associated with your group records, you will need to add related option fields from policy details to your report.
Note: For each related option field you select, it may duplicate the record line. If this happens, an in-app message will appear at the bottom of the window. For example, if a policy has two notes, two rows of policy data would be returned for that policy to account for the two unique notes.
Adding filters & columns
After selecting a report type, add filters to specify what data will pull into your custom reports and add columns to organize that data.
What are filters?
Filters are sets of instructions that influence a query, which pulls data into a report. A filter consists of a field, an operator (data type), and a value editor (field type). Multiple filters will automatically include connectors (conditions) that specify how the filters are combined in the query.
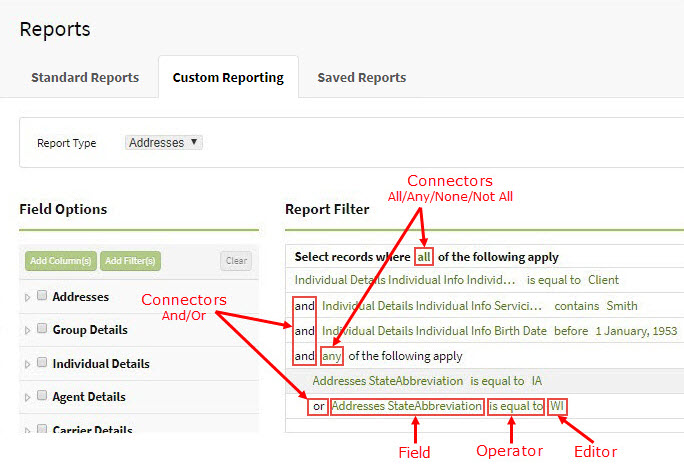
You can create a filter by first adding a field from the Field Options panel to the Report Filters panel. Next, you’ll set an operator. The operator compares the selected field to a value that you specify in the value editor. If using multiple filters, make sure the displayed connectors reflect the desired behavior.
Once a filter is created, this set of instructions will tell the query what records to include or exclude from your report.
For more details about operators, value editors and connectors, visit the Adding Filters to Custom Servicing Reports article.
What are Columns?
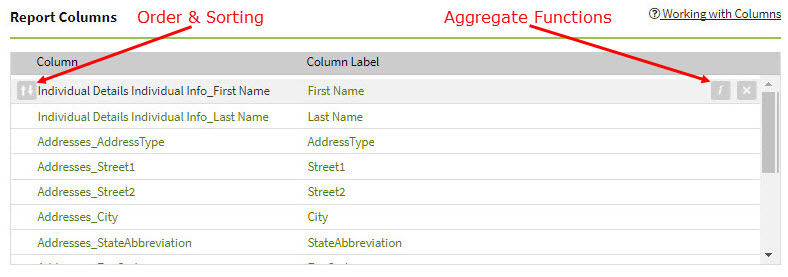
Columns are fields that you select to display in your report. You can set up columns by adding fields from the Field Options panel to the Report Columns panel. You can organize the columns that appear in your report preview and download. You can also customize column labels and apply aggregation functions.
Aggregation functions include sums and counts.
For more details about customizing columns and aggregation functions, visit the Adding Columns to Custom Servicing Reports article.
Previewing & saving
After setting the filters and columns, you can preview your custom report in AMS+ before downloading it to your computer. Think of the preview like a rough draft. You're reviewing it to make sure it has the data you need before downloading the final version.
Note: The preview will only show the first 100 results. To view all results, you can download the report as a .xls or .csv file.
Once everything is set to your liking, you can save the report to run it again later without rebuilding it from scratch. Saving a report retains the filter and column settings, and the data updates dynamically every time it's run.
For more details, visit the Previewing and Saving Custom Servicing Reports article.
Sharing reports
After saving a custom report, you can share it with others at your agency. Sharing allows you to create a report once and then give others access to it. Please note, permissions in group security settings will affect who can view and run each report, as well as what data will pull into them.
As the owner of the original report, only you may edit the report options, filters, and columns. Once shared, others may view, run, and create copies of your report.
For more details about sharing options and permissions, visit the Sharing Custom Servicing Reports article.